
![]()
![]()
The flextable package provides a framework for easily creating tables
for reporting and publications. Tables can be formatted with a set of
verbs such as bold(), color(), they can
receive a header of more than one line, cells can be merged or contain
an image. The package makes it possible to build any table for
publication from a data.frame and provides convenience
function as_flextable() to convert several R objects to a
flextable, such as an object returned from table() or a
model.
Tables can be embedded within HTML, PDF, Word and PowerPoint documents from R Markdown and Quarto documents and within RTF or Microsoft Word or PowerPoint documents with package officer. Tables can also be exported as image files (png, svg) or combined with ggplot2 plots in patchwork layouts.
flextable(mtcars) |>
  theme_vanilla() |>
  save_as_docx(path = "mytable.docx")
A flextable object is a data.frame representation. An
API is available to let R users create tables for reporting and control
their formatting properties and their layout. The package provides
functions that give control over:
The package also offers a set of high-level functions that allow tabular reporting of statistical models and the creation of complex cross tabulations.
library(flextable)

flextable(head(airquality))
Formatting can be layered on with a set of functions:
flextable(head(mtcars)) |>
  highlight(i = ~ mpg < 22, j = "disp", color = "#ffe842") |>
  bg(
    j = c("hp", "drat", "wt"),
    bg = scales::col_quantile(palette = c("wheat", "red"), domain = NULL)
  ) |>
  add_footer_lines("The 'mtcars' dataset")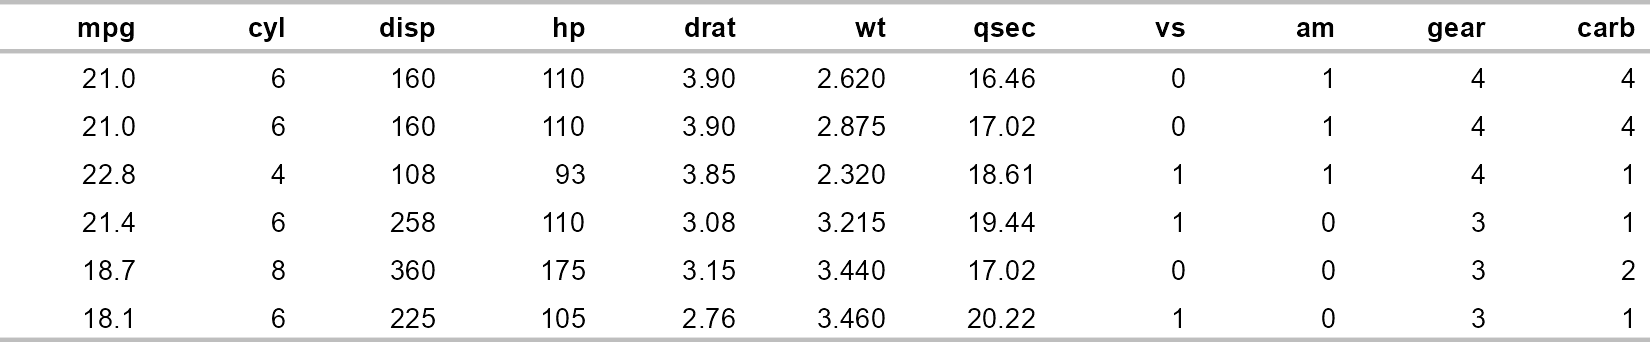
ggplot2::diamonds[, c("cut", "carat", "price", "clarity", "table")] |>
  summarizor(by = c("cut")) |>
  as_flextable(spread_first_col = TRUE)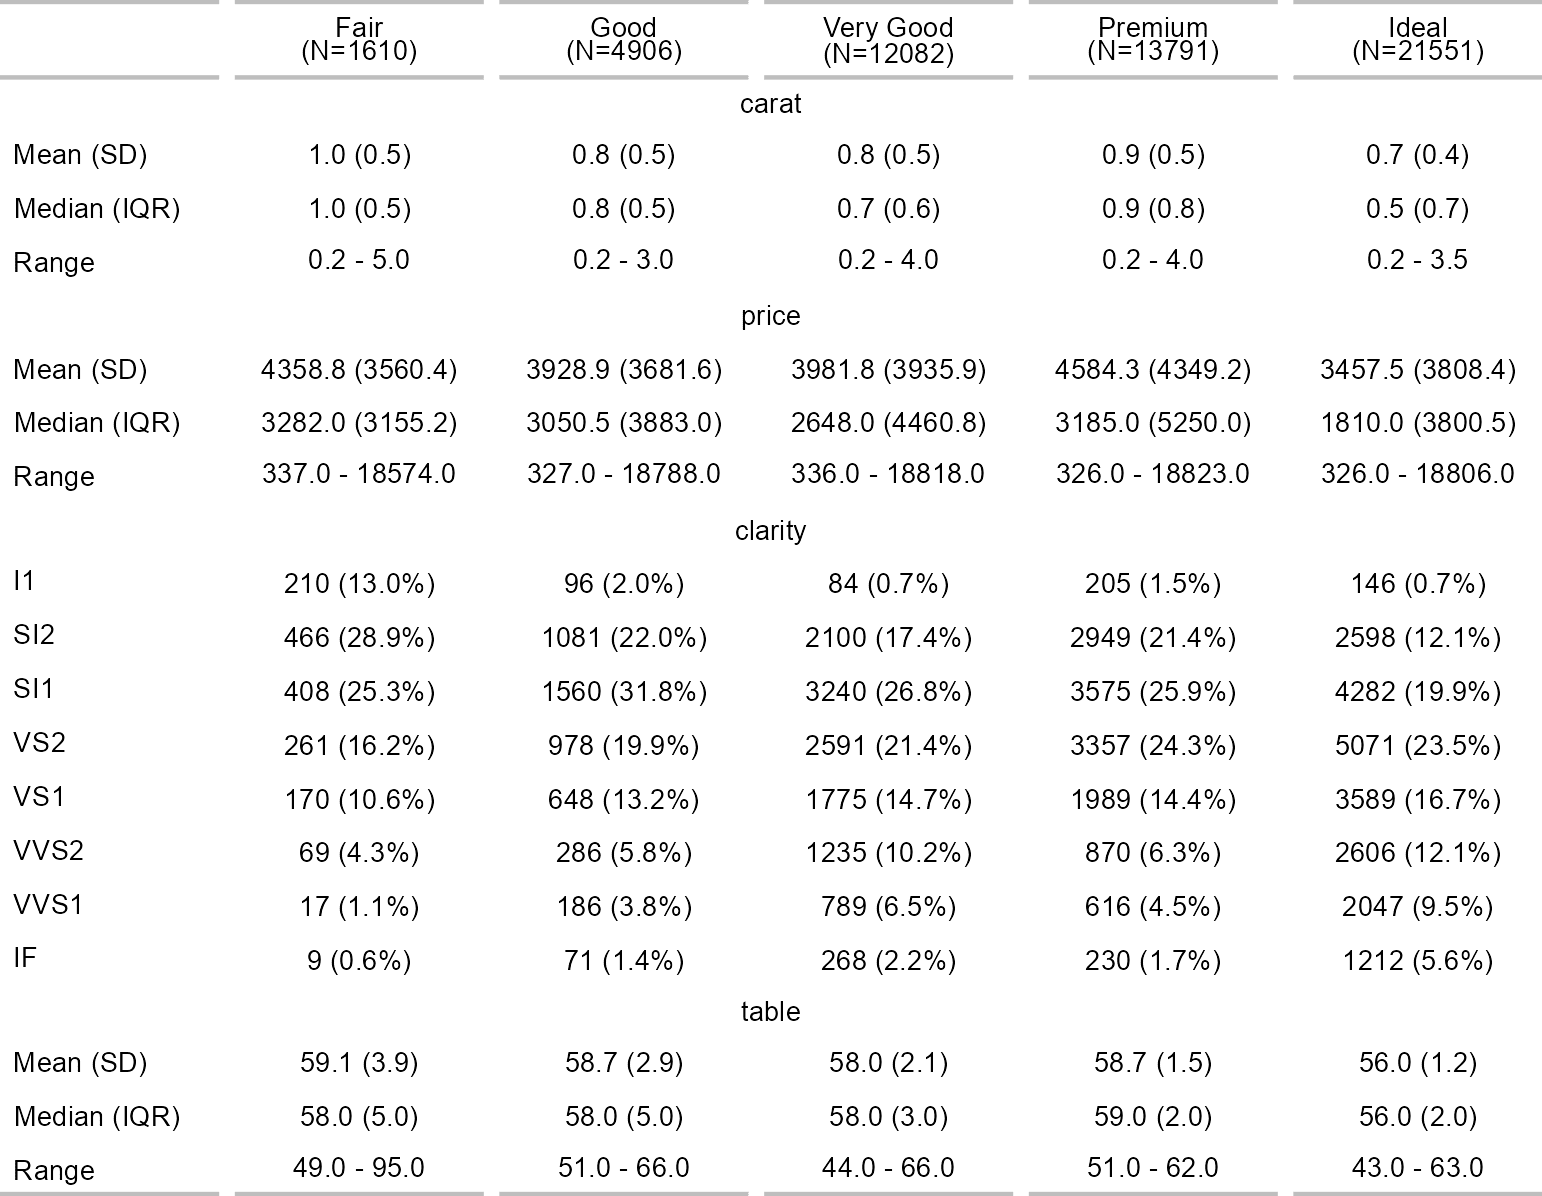
install.packages("flextable")You can get the development version from GitHub:
devtools::install_github("davidgohel/flextable")When you file a bug report, please spend some time making it easy for us to reproduce. If you take the time to make the bug report consistent, it will be easier to fix.