
![]()
![]()
![]()


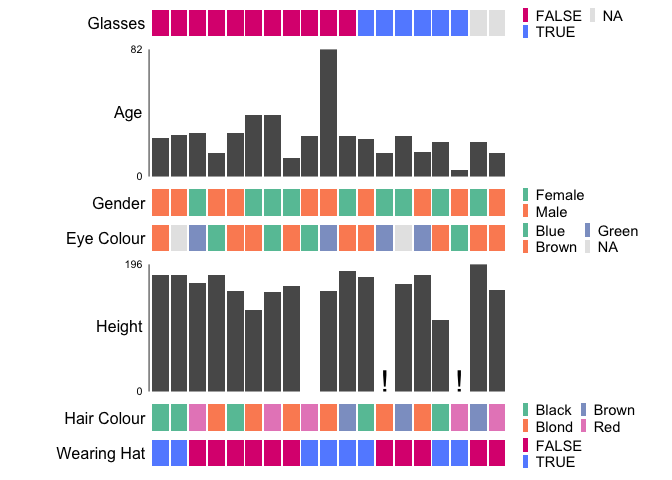
ggEDA streamlines exploratory data analysis by providing turnkey approaches to visualising n-dimensional data which can graphically reveal correlative or associative relationships between two or more features:
To create ggEDA visualisations through a shiny app see interactiveEDA
install.packages("ggEDA")You can install the development version of ggEDA from GitHub with:
if (!require("remotes"))
    install.packages("remotes")

remotes::install_github("CCICB/ggEDA")
Or from R-universe with:
install.packages("ggEDA", repos = "https://ropensci.r-universe.dev")For examples of interactive EDA plots see the ggEDA gallery
# Load library
library(ggEDA)

# Plot data, sort by Glasses
ggstack(
  baseballfans,
  col_id = "ID",
  col_sort = "Glasses",
  interactive = FALSE,
  verbose = FALSE,
  options = ggstack_options(legend_nrow = 2)
)
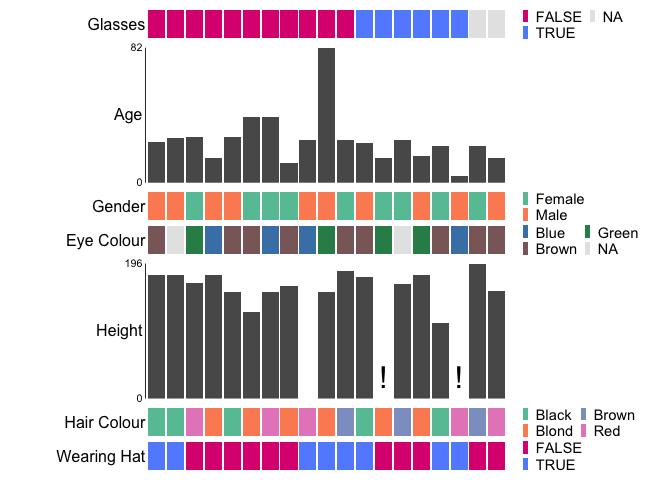
Customise colours by supplying a named list to the
palettes argument
ggstack(
  baseballfans,
  col_id = "ID",
  col_sort = "Glasses",
  palettes = list("EyeColour" = c(
    Brown = "rosybrown4",
    Blue = "steelblue",
    Green = "seagreen"
  )),
  interactive = FALSE,
  verbose = FALSE,
  options = ggstack_options(legend_nrow = 2)
)
Infinite values in numeric colums are indicated with directional (↓
& ↑) arrows to differentiate them from missing (NA) values which are
represented by !.
data <- data.frame(
  numbers = c(1:3, Inf, -Inf, NA),
  letters = LETTERS[1:6]
)

ggstack(data, interactive = FALSE, verbose = FALSE)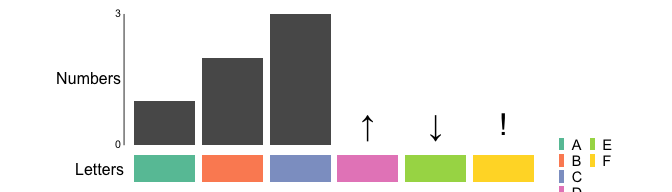
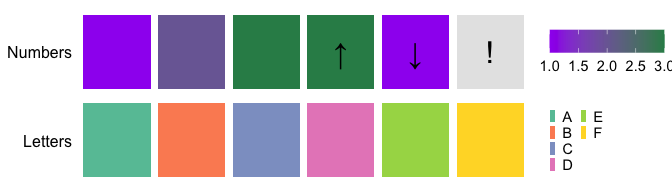
If rendering numeric columns as heatmaps, infinite values are clamped
to the min/max colours, while na values remain grey. We can optionally
add markers by setting show_na_marker_heatmap = TRUE
ggstack(
  data,
  interactive = FALSE,
  verbose = FALSE,
  options = ggstack_options(numeric_plot_type = "heatmap", show_na_marker_heatmap = TRUE)
)
For datasets with many observations and mostly numeric features, parallel coordinate plots may be more appropriate.
ggparallel(
 data = minibeans,
 col_colour = "Class",
 order_columns_by = "auto",
 interactive = FALSE
)
#> ℹ Ordering columns based on mutual information with [Class]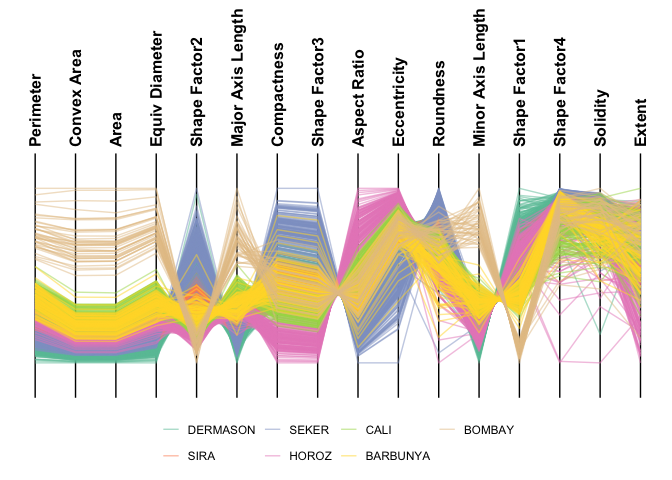
 ggparallel(
   data = minibeans,
   col_colour = "Class",
   highlight = "DERMASON",
   order_columns_by = "auto",
   interactive = FALSE
 )
#> ℹ Ordering columns based on how well they differentiate 1 group from the rest [DERMASON] (based on mutual information)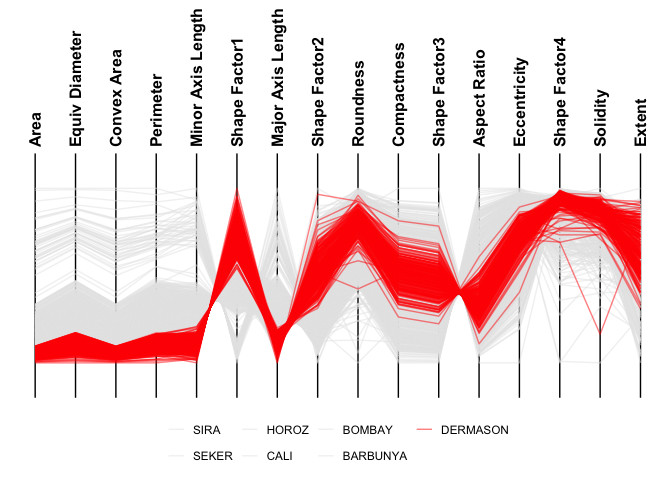
 ggparallel(
   data = minibeans,
   order_columns_by = "auto",
   interactive = FALSE
 )
#> ℹ To add colour to plot set `col_colour` to one of: Class
#> ℹ Ordering columns to minimise crossings
#> ℹ Choosing axis order via repetitive nearest neighbour with two-opt refinement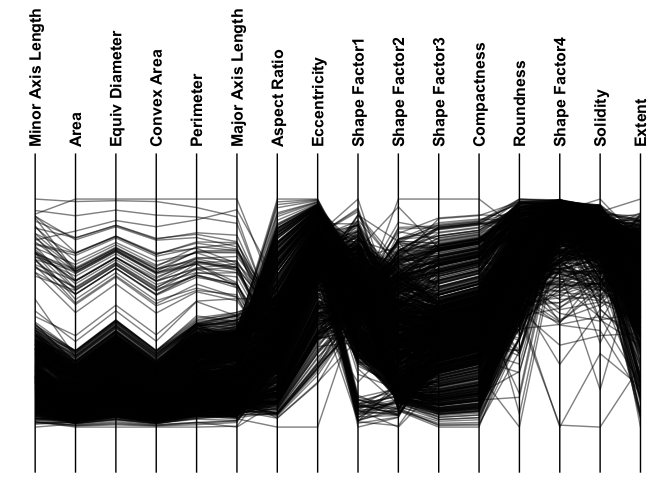
All types of contributions are encouraged and valued. See our guide to community contributions for different ways to help.