![]()
The munsell package provides easy access to, and
manipulation of, the Munsell colours. The munsell package
provides a mapping between Munsell’s original notation (e.g. “5R 5/10”)
and hexadecimal sRGB strings suitable for use directly in R graphics.
The package also provides utilities to explore slices through the
Munsell colour tree, to transform Munsell colours and display colour
palettes.
Munsell devised his system of colour notation to match the three perceptual dimensions of colour: hue, value and chroma. His notation provides a naming scheme to colours that eases the choice of color according to a specific purpose. His century old advice is still relevant for the producers of statistical graphics and the munsell package aims to enable user to easily follow it.
munsell relies directly on the published tables in
Newhall, Nickerson, and Judd (1943) of CIE XYZ (Illuminant C) values for
Munsell colours. These tables were the result of colour matching studies
on Munsell’s color samples along with some smoothing and extrapolation
with Munsell’s goal of perceptually uniform spacing in mind.
Currently the munsell package only includes hue in steps
of 2.5, value in steps of 2 and chroma in steps of 1, corresponding
directly to the entries in Table 1 in Newhall, Nickerson, and Judd
(1943). If you require a more continuous mapping, see munsellinter.
Functions in munsell fall into three basic use
categories: specifying Munsell colours, altering Munsell colours and
exploring the Munsell color space.
The code below relies on the development version of
munsell, get it with:
devtools::install_github("cwickham/munsell")Following Munsell, specifying colours is done with a specific string
format: “H V/C” where H is a hue code (see mnsl_hues() for
a list of those available, excluding “N”), V an integer in \([0, 10]\) specifying value, and C an even
integer specifying chroma. The mnsl function takes the
string and returns a hexadecimal RGB representation:
library(munsell)
mnsl("5R 5/10")
#> [1] "#C65858"
Visually examining a colour can either be done by using
mnsl with a base plotting call, or using
plot_mnsl which plots colour swatches using
ggplot2:
plot.new()
rect(0, 0, 1 ,1 , col = mnsl("5R 5/10"))
plot_mnsl("5R 5/10")munsell provides convenience functions that alter a
colour by taking steps in the hue, value and chroma dimensions:
rygbp, pbgyr, lighter,
darker, saturate and
desaturate.
my_blue <- "5PB 5/8"
p <- plot_mnsl(c(
  lighter(my_blue, 2),      my_blue,   darker(my_blue, 2),
  desaturate(my_blue, 2),   my_blue,   saturate(my_blue, 2),
  rygbp(my_blue, 2),        my_blue,   pbgyr(my_blue, 2)))
p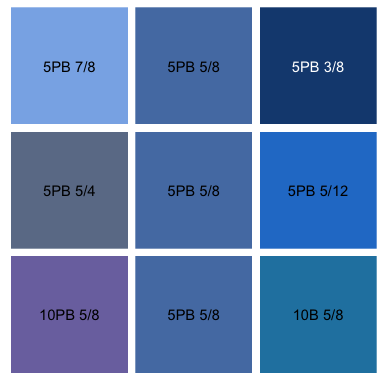
Each function optionally takes the number of steps to take in the dimension and consequently are easily used to create scales in a particular dimension.
p <- plot_mnsl(sapply(0:6, darker, col = "5PB 7/4"))
p + ggplot2::facet_wrap(~ num, nrow = 1)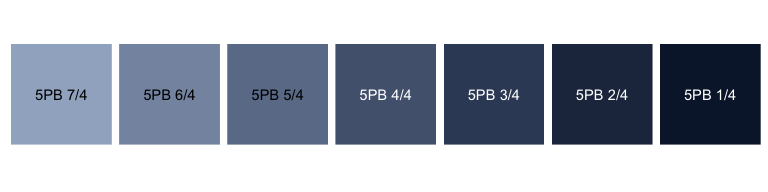
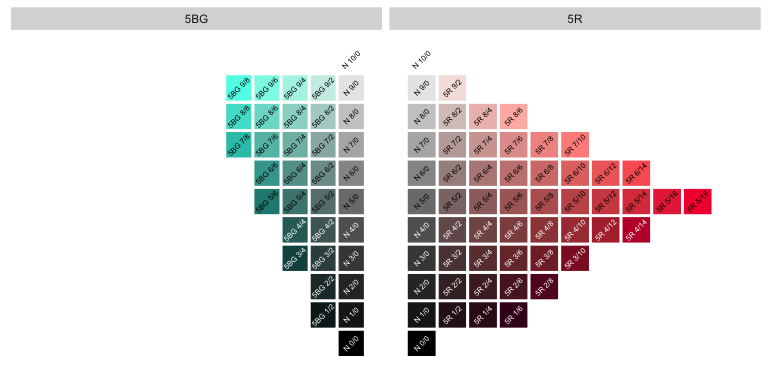
Slices through the colour space of constant hue, chroma or value can
be displayed using the functions: hue_slice,
chroma_slice and value_slice. Additionally
complement_slice displays a slice of constant hue,
alongside a slice of its complement, the hue that is on the opposite
side of the colour sphere to that specified.
complement_slice("5R")