---
title: "Data Visualization (Electrodes)"
output:
rmarkdown::html_vignette:
toc: true
vignette: >
%\VignetteIndexEntry{Data Visualization (Electrodes)}
%\VignetteEngine{knitr::rmarkdown}
%\VignetteEncoding{UTF-8}
---
```{r, include = FALSE}
knitr::opts_chunk$set(
collapse = TRUE,
comment = "#>",
eval = FALSE
)
```
This article uses `N27` sample files mentioned by the previous vignettes. If you are using this example, please execute the following R code to set up. Alternatively, you can substitute variables `subject_code` and `subject_path` accordingly.
```{r setup, eval=FALSE}
library(threeBrain)
subject_code <- "N27"
subject_path <- "~/Downloads/N27"
brain <- threeBrain(subject_path, subject_code)
```
## Add Electrodes
To add electrodes to the brain object, you need a electrode table with least 5 columns: `Subject`, `Coord_x`, `Coord_y`, `Coord_z`, `Label`. The column names are case-sensitive.
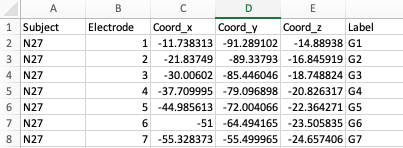{width=80%}
If you have performed electrode localization (see the previous article) and exported the electrode table, the exported table can be used here once `Electrode` is filled out.
For demonstration purposes, this [electrode table](https://raw.githubusercontent.com/dipterix/threeBrain-sample/master/vignettes/electrodes.csv) will be used. Please download this file and place it at `~/Downloads/N27/electrodes.csv`
```{r, eval=FALSE}
electrode_table <- `~/Downloads/N27/electrodes.csv`
brain$set_electrodes(electrode_table)
brain$plot()
```
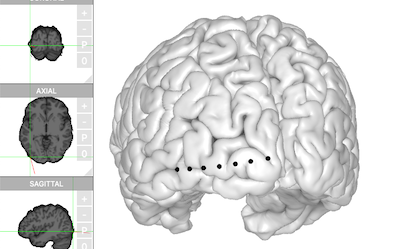{width=100%}
## Add Electrode Values
In iEEG study, various of analyses can be performed on the electrodes. The analysis results are different, including
* functional data such as mean-response over time
* continuous data like p-values, z-scores
* categorical data such as cluster labels
`threeBrain` can visualize them all with two lines and one data table.
First, let's take a look
To start, generate a table as follows:
|Project |Subject | Electrode| Time| sine_wave| p_value| z_score|cluster |
|:-------|:-------|---------:|----:|---------:|-------:|-------:|:-------|
|demo |N27 | 1| 0.00| 0.20| 0.05| 1.96|A |
|demo |N27 | 1| 0.50| 0.88| 0.05| 1.96|A |
|demo |N27 | 1| 1.00| 0.98| 0.05| 1.96|A |
|demo |N27 | 2| 0.00| 0.38| 0.01| 2.58|A |
|demo |N27 | 2| 0.44| 0.89| 0.01| 2.58|A |
|demo |N27 | 2| 0.89| 0.98| 0.01| 2.58|A |
|demo |N27 | 3| 0.00| 0.56| 0.28| 1.09|A |
|demo |N27 | 3| 0.11| 0.69| 0.28| 1.09|A |
|...|
The column names are case-sensitive, and should only contain letters, digits and `_`.
* `Project`: (optional) the project name that this experiment belongs to
* `Subject`: (mandatory) the subject code; must be consistent with the brain subject code
* `Electrode`: (mandatory) integers of electrode channel number; correspond to the `Electrode` column in the electrode table
* `Time` (optional) numerical time in seconds
* Value columns (such as `sine_wave`, `p_value`, `z_score`, and `cluster`): values of the electrodes
Download sample value table from [here](https://github.com/dipterix/threeBrain-sample/blob/master/vignettes/values.csv) and save it to `~/Downloads/N27/values.csv`
```{r, eval=FALSE}
electrode_table <- `~/Downloads/N27/electrodes.csv`
value_table <- `~/Downloads/N27/values.csv`
brain$set_electrodes(electrode_table)
brain$set_electrode_values(value_table)
brain$plot()
```
Open `Data Visualization` panel, change `Display Data` or use keyboard shortcut `d` (make sure the mouse is hovering on the brain) to switch to desired variables.
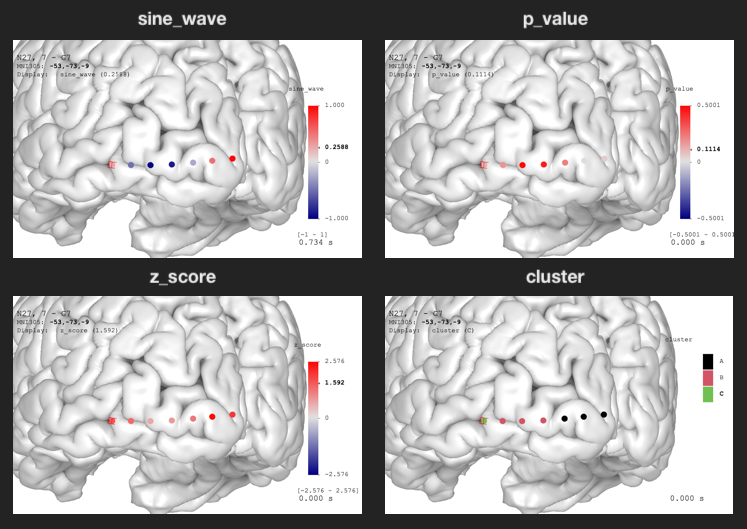{width=100%}
The `sine_wave` is time series. You can see the animation by toggling `Play/Pause` option in the `Data Visualization` panel.
### Change Color Palette
In the example above, the p-value legend shows the range is from `-0.5` to `0.5`. This is because `threeBrain` viewer's default palette is symmetric around zero, and the range is decided by the maximum absolute number. However, the actual p-value should range from `0` to `1`, and we might be particularly interested in `$p \leq 0.05$`. This means both the color palette and value range need to be corrected.
In the following code, `value_ranges` is a named list of such value ranges. `"p_value"=c(0,1)` suggests that the `p_value` variable should range from 0 to 1. All other variables adopt the default ranges. `palettes` is a named list of color palettes. In this specific case, variable `pal` is a vector of 64 colors. `colorRampPalette` is a base-R function to interpolate colors. Please use `help("colorRampPalette")` to see the documentation.
```{r, eval=FALSE}
pal <- c(
colorRampPalette(c("red", "#FFC6C6"))(8),
colorRampPalette(c("#FFC6C6", "white"))(56)
)
brain$plot(
value_ranges = list( "p_value" = c(0, 1) ),
palettes = list( "p_value" = pal )
)
```
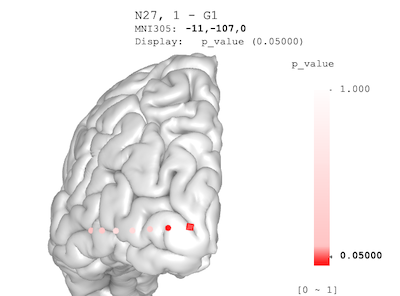{width=50%}
## Map Electrode Values to the Surface
`threeBrain` provides value mapping that allows electrode values to be displayed on the surfaces. To enable this feature,
open `Surface Settings` panel, and click on `Surface Color`, switch to `sync from electrodes`, or simply use keyboard shortcut `k` (make sure the mouse is hovering over the brain) to change.
You can also hide the electrodes by switching the electrode `Visibility` to `hidden` in the `Electrodes` panel to only show the mapped results.
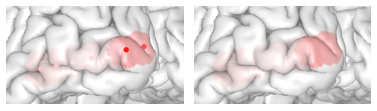{width=80%}