![]()
The ESTIMATE package has been fundamental for inferring tumor purity from expression data, but its documentation is lacking, and its functions sometimes overstep their bounds while not doing enough. This package is a refresh of ESTIMATE with the goal of maintaining the excellent backbone of the package while increasing its documentation and function scope.
You can install the released version of tidyestimate from CRAN with:
install.packages("tidyestimate")And the development version from GitHub with:
# install.packages("devtools")
devtools::install_github("KaiAragaki/tidy_estimate")| tidyestimate | ESTIMATE | |
|---|---|---|
| input | data.frametibblematrix |
.GCT file |
| output | data.frame |
.GCT file |
%>%/\\|>? |
✔️ | ✖️ |
| size | <1MB | ~7MB |
Additionally:
⚡ Faster. tidyestimate doesn’t do any file
conversion.
📝 Better documentation. Functions are more clear about input requirements and returns.
🕊️ Lighter. Less code, more readable (less to break, easier to fix).
💪 Robust. tidyestimate does conservative alias matching
to allow compatibility with both old and new gene identifiers.
Evaluating tumor purity with tidyestimate is simple.
tidyestimate can take a matrix or
data.frame (and thus a tibble). In this
example, we’ll be using the ov dataset, which is derived
from the original estimate package. It’s a matrix with
expression data (profiled using an array-based Affymetrix method) for 10
ovarian cancer tumors.
library(tidyestimate)dim(ov)
#> [1] 17256 10head(ov)[,1:5]
#> s516 s518 s519 s520 s521
#> C9orf152 4.8815 4.5757 3.7395 3.6960 4.1597
#> ELMO2 7.2981 7.5554 7.5332 7.3824 7.3079
#> CREB3L1 5.5692 5.7004 5.9597 5.7700 5.2190
#> RPS11 13.3899 13.8488 13.6429 13.6546 13.5698
#> PNMA1 9.3480 10.0092 10.4310 9.5399 9.6423
#> MMP2 7.6182 8.0369 8.9551 10.3875 7.4141Tumor purity can be predicted like so:
scores <- ov |>
  filter_common_genes(id = "hgnc_symbol", tell_missing = FALSE, find_alias = TRUE) |>
  estimate_score(is_affymetrix = TRUE)
#> 461 of 488 missing genes found matches using aliases.
#>
#> Found 10364 of 10391 genes (99.74%) in your dataset.
#> Number of stromal_signature genes in data: 141 (out of 141)
#> Number of immune_signature genes in data: 141 (out of 141)
scores
#>    sample    stromal     immune   estimate    purity
#> 1    s516 -285.49841  165.75062  -119.7478 0.8323791
#> 2    s518 -429.16931   99.71302  -329.4563 0.8490421
#> 3    s519  -60.98619 -368.70314  -429.6893 0.8567232
#> 4    s520 1927.51431 2326.15984  4253.6742 0.3348246
#> 5    s521 -673.84954  141.72775  -532.1218 0.8643812
#> 6    s522 1447.95517 1166.51854  2614.4737 0.5497248
#> 7    s523 -271.15756 -928.44921 -1199.6068 0.9094242
#> 8    s525  965.61804 1310.27775  2275.8958 0.5905450
#> 9    s526  545.99467 2149.10473  2695.0994 0.5398002
#> 10   s527 -710.44370 1303.08009   592.6364 0.7699846
They can also be plotted in context of the Affymetrix profiled tumors used to generate the ESTIMATE model:
scores |>
plot_purity(is_affymetrix = TRUE)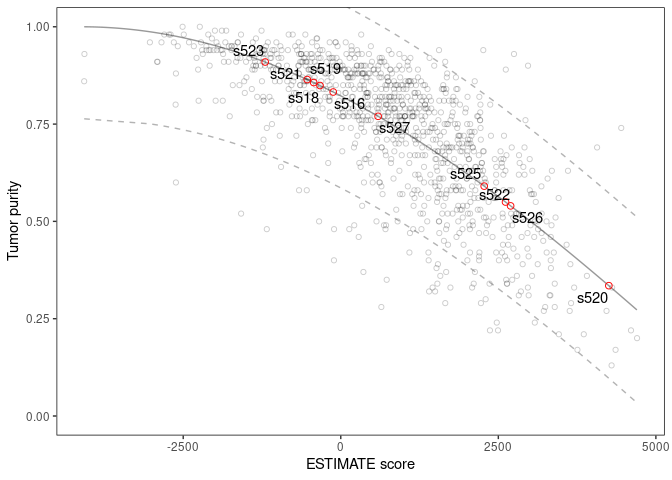 A
more detailed version of this example can be found in the vignette of
this package.
A
more detailed version of this example can be found in the vignette of
this package.