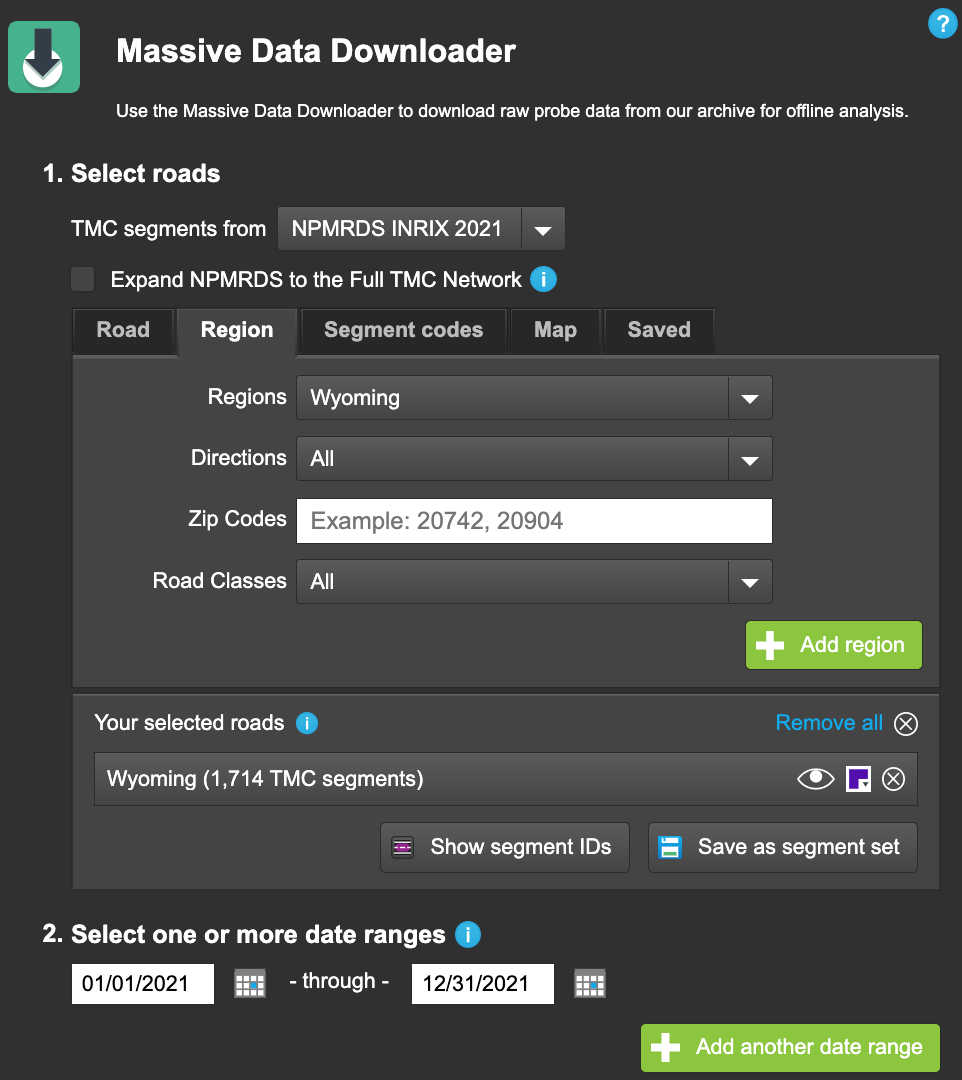
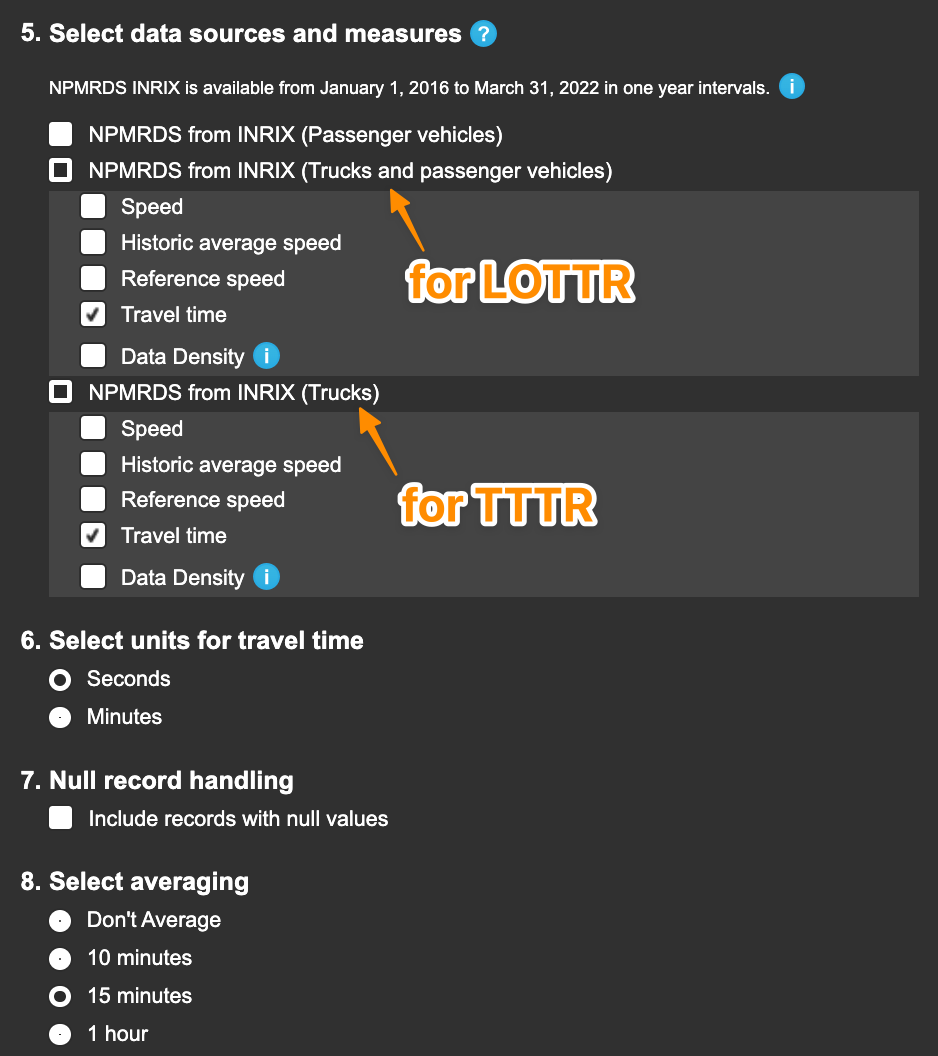
- “NPMRDS form INRIX (Trucks and Passenger Vehicles): Travel Time” for LOTTR Measure (the other fields are optional)
- “NPMRDS from Inrix (Trucks): Travel Time” for TTTR Measure
lottr and tttr.
Monthly scores may be calculated using monthly = TRUEThis repository provides some scripts and tools written in R for effectively working with voluminous NPMRDS data for calculating the FHWA Transportation Performance Management (TPM) PM3 System Reliability, Freight, and CMAQ Congestion Performance Performance Measures. For use with NPMRDS (2016 – Present) downloaded from https://npmrds.ritis.org/
The package consists of the following:
lottr and tttr functions calculate
TMC-segment Level of Travel Time Reliability (LOTTR) and Truck Travel
Time Reliability (TTTR) metric scores. These are used to calculate
Interstate / Non-Interstate NHS Percent of Person Miles Reliable and
TTTR Index performance measures (see example code)phed function calculates the Annual Hours of Peak
Hour Excessive Delay per Capita performance measurehpms function generates an HPMS Submittal File
based on the HPMS Field
Manual Supplemental Guidancelibrary(devtools)
devtools::install_github("markegge/fhwa_pm3")
library(tpm)To run the example below, create a RITIS NPMRDS export using the
instructions below or copy Readings.csv,
TMC_Identification.csv and speed_limits.csv
from tests/testthat into your working directory. Note, the
example below uses the same readings file is used for both the LOTTR and
TTTR metrics. In the real world, the LOTTR metric should use All
Vehicles travel time data, and the TTTR metric should use Trucks travel
time data.
library(data.table)
library(tpm)

# Calculate segment-level LOTTR and TTTR scores
# Using "All Vehicles" readings file only for demo purposes
lottr_scores <- lottr("Readings.csv")
tttr_scores <- tttr("Readings.csv")

# Read in TMC attributes from RITIS export
tmcs <- fread("TMC_Identification.csv")

tmcs[, nhs_miles := miles * nhs_pct * 0.01]
tmcs[, vmt := ifelse(faciltype == 1, 1.0, 0.5) * aadt * nhs_miles]
tmcs[, system := ifelse(f_system == 1, "Interstate", "Non-Interstate NHS")]

# Merge the scoress table to the TMCs attribute table
tmcs <- merge(tmcs, lottr_scores, by.x = "tmc", by.y= "tmc_code")
tmcs <- merge(tmcs, tttr_scores, by.x = "tmc", by.y= "tmc_code", all.x = TRUE)

# Calculate LOTTR scores
tmcs[!is.na(vmt), .(pct_reliable = sum(vmt * reliable) / sum(vmt)), by = system]
#>                system pct_reliable
#> 1: Non-Interstate NHS    0.7545984
#> 2:         Interstate    1.0000000

# Calculate TTTR score
tmcs[f_system == 1, .(tttr_index = sum(max_tttr * nhs_miles) / sum(nhs_miles))]
#>    tttr_index
#> 1:       1.08

# Calculating Peak Hour Excess Delay
phed_scores <- phed(travel_time_readings = "Readings.csv",
                    tmc_identification = "TMC_Identification.csv",
                    speed_limits = fread("speed_limits.csv"),
                    urban_code = 56139,
                    population = 52898)
#> Peak Hour Excess Delay per Capita for 2020: 0.13 hours

# Generate an HPMS Submittal File
# Requires verbose = TRUE for LOTTR and TTTR scores
hpms("TMC_Identification.csv",
     lottr("Readings.csv", verbose = TRUE),
     tttr("Readings.csv", verbose = TRUE),
     phed_scores)
#> Writing output to hpms_2021.txtTo calculate LOTTR or TTTR Metric scores:
lottr and tttr.
Monthly scores may be calculated using monthly = TRUEThe package phed() function implements the calculation
procedures in FHWA’s guidance: National
Performance Measures for Congestion, Reliability, and Freight, and CMAQ
Traffic Congestion (CMAQ PHED Calculation Procedures)
Usage:
phed(
  travel_time_readings,
  tmc_identification,
  speed_limits,
  urban_code,
  pm_peak = 3,
  avo_cars = 1.7,
  avo_trucks = 1,
  avo_buses = 10.7,
  moy_factor = moy_factor_default,
  dow_factor = dow_factor_default,
  hod_profile = hod_profile_default,
  population = NA
)At a minimum, the phed() function requires speed limits
for all TMC segments. The speed limits should be provided in a
data.frame-like object in the following format:
| tmc | speed_limit |
|---|---|
| 000+10001 | 65 |
| 000-10002 | 65 |
| 000+10003 | 55 |
An urbanized area code must by provided to filter the travel time observations to only the TMC segments within the matching urban area. (The easiest way to determine the urban area is to open the TMC shapefile and select a segment within the urban area to look up the urban_area field value.)
Per FHWA’s guidance, the morning peak traffic hours occur between 6
am and 10 am. Agencies may choose their afternoon peak period as either
3 – 7 pm or 4 – 8 pm. For 3 – 7 pm, use
phed(..., pm_peak = 3). For 4 – 8 pm, use
phed(..., pm_peak = 4).
Average vehicle occupancies are used to estimate person hours for delayed vehicles.
Default average vehicle occupancy (AVO) factors are provided (AVO Cars = 1.7, AVO Trucks = 1, AVO Buses = 10.7) based on FHWA guidance. Default occupancy for cars is 1.7, trucks is 1, and buses = 10.7. Using AVO factors that are specific to your urban area are recommended. Urban-area specific data may be obtained via a local survey or from the NHTS. More details on obtaining local occupancy factors is provided by FHWA: Average Vehicle Occupancy Factors for Computing Travel Time Reliability Measures and Total Peak Hour Excessive Delay Metrics (April 2018)
Additionally, traffic volume factors and profiles are used to
traslate AADT values (included in the NPMRDS
TMC_Identification.csv file from HPMS) to hourly estimated
“persons”. Default profiles have been built into the function, but users
are encouraged to use profiles that are specific the urbanized area.
Factors must be provided for both freeway and non_freeway facilities
(though these may be the same).
Factors must be provided in the format below:
Factors should correspond the mutliplicative factor to make an AADT value specific to the month.
| month | freeway | non_freeway |
|---|---|---|
| 1 | 0.95 | 0.96 |
| 2 | 0.9 | 0.92 |
| … | … | … |
| 12 | 1.01 | 0.99 |
Day of week factors must be provided for weekdays using integer values for weekdays for a 7-day week beginning on Sundays (e.g. Monday = 2, Tuesday = 3, Wednesday = 4, Thursday = 5, Friday = 6).
| day | freeway | non_freeway |
|---|---|---|
| 2 | 1.05 | 1.05 |
| 3 | 1.05 | 1.05 |
| … | … | … |
| 6 | 1.10 | 1.10 |
The hourly volume profile must be provided for peak hours integer values for hours of the day (e.g. 6:00 am = 6). Note, values for freeway and non_freeway should correspond to the percent of daily traffic occuring during the hour. The profile may be provided for all 24 hours, or for selected peak hours only.
| hour | freeway | non_freeway |
|---|---|---|
| 6 | 0.05 | 0.05 |
| 7 | 0.08 | 0.075 |
| … | … | … |
| 19 | 0.08 | 0.07 |
If the population argument is provided, the function will output the calculated PHED per capita measure. The function returns a data.table with PHED per TMC.
The hpms() function outputs a .txt file in the
appropriate format for HPMS submission. See the (HPMS Supplemental
Guidance for
PM3)[https://www.fhwa.dot.gov/tpm/guidance/pm3_hpms.pdf]
If the optional PHED scores are not provided (not required for all states), the PHED value is set to 0 (in accordance with FHWA guidance).
The input lottr and tttr scores
must be generated with verbose = TRUE.
The output is generated for the year corresponding to the TMCs in the TMC Identification file.
# Calculating Peak Hour Excess Delay
speed_limits <- speed_limits = fread("speed_limits.csv")
phed_scores <- phed("data/all_vehicles/Readings.csv",
                    "TMC_Identification.csv",
                    speed_limits,
                    urban_code = 56139)

# Generate an HPMS Submittal File
hpms("TMC_Identification.csv",
     lottr("data/all_vehicles/Readings.csv", verbose = TRUE),
     tttr("data/trucks/Readings.csv", verbose = TRUE),
phed_scores)The PM3 Performance measures are best described in FHWA’s June 1, 2017 PM3 Webinar Presentation
FWHA has also provided two sets of guidance on calculating the LOTTR and TTTR performance metrics:
You can also reference the definitive Federal Register PM3 Final Rule.
Each year the TMC network is updated. This reflects improvements in TTI’s conflation methodolgies, corrections submitted by users, as well as changes in the underlying attribute data.
The NPMRDS TMC network is a set of INRIX/HERE TMC segments to which selected HPMS attribtues have been conflated. There is a two year lag between the TMC network and the HPMS data. For example, the 2019 NPMRDS TMC network reflects AADT values based on 2017 HPMS. Since FHWA only requires traffic counts once every three years, some AADT values reported in the 2019 NPRMDS TMC network may be based on 2014 traffic counts. The NPMRDS reported AADT values should be calculating PM3 Performance Measures, but for other analysis it is better to use more recent sources of traffic counts.
For a method for estimating order-of-magnitude traffic volumes using NPMRDS data itself, see this repository.
Package author: Mark Egge, High Street (egge@highstreetconsulting.com)
License: Mozilla Public License Version 2.0
lottr() and tttr() respectively, rather than
score(). HPMS function now accepts PHED scores.